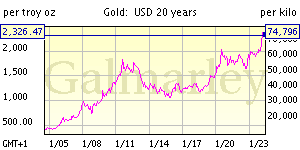
The big debate in academic circles today is over whether we are going to see inflation or deflation going forward.
The inflationists site rising food and natural resources prices as evidence that all the money printing that has been going on will continue to force prices higher.
On the other side, the deflationists site the bursting real estate bubble as evidence that we are entering into a deflationary cycle that will see prices falling across the board.
Which camp is right?
I think the argument can be made that they both are. There is no law in nature that says "ALL" prices must be rising or falling at the same time. Each commodity, whether talking about housing or food for example, will certainly be affected by monetary policy overall. But also, each commodity will also be affected by its own supply and demand dynamics.
Therefore, going forward, I see no reason to expect commodity prices to quit rising. I also see no reason to expect real estate prices to quit falling. They each have their own unique set of supply and demand forces at work.
Concerning food/natural resources/etc., there are more and more people on this earth fighting for a limited amount of natural resourses. And specifically, regarding food, when you factor in floods and droughts, it becomes obvious that falling supply and rising demand will lead to higher prices. There is no force at work that can reverse this trend in the immediate future.
Conversely, regarding residential real estate as our deflationists example, we see the opposite happening. Supply is rising as homeowners are increasingly deleveraging, either through choice, or default. Hence, we have more supply than demand, leading to lower prices. With unemployment continuing to rise, bringing with it more and more defaults, there is no force at work today in the market that stands as a catalyst to change this trend.
Now, the million dollar "investments" question is this. How low can home prices fall? Where's the bottom? When will it be time to jump back in?
Here's two graphs for your consideration, each one telling a different story.

The above graph clearly shows the housing bubble that we have experienced. This graph, going back to 1970, seems to indicate that prices are now back in line and it might be time to jump back into this market. However, before jumping to that conclusion, consider the same price data going back to 1890.

When we view the above graph, and in particular the period of time of the last period of deflation our nation went through in the 30s and 40s, it becomes apparent that our residential real estate prices could come down a lot more.
How much more?
Considering the low point in the Great Depression had inflation adjusted home values at about $75,000 would indicate that the homes that were selling for about $250,000 at the peak of the bubble could see a bottom of around $75,000 if this deleveraging period equals that of the 30s. Percentage wise, this will be a price of about 30 cents on the dollar from peak to trough.
However, my contention has always been that markets always over react and we will see this cycle bottom at much lower levels. Once the snowball starts rolling downhill again, it will be much harder to stop this time than it was over the last few years. The feds have almost bankrupted the dollar by their massive money printing efforts to stop the current slide. If/when the next wave of selling hits, will they have enough ammo left to save residential real estate prices from plunging into the abyss?
Good question, but for my money, I still think there is too much downside risk in residential real estate at this point to justify re-entry.
Again, keep your powder dry in gold and/or other commodities that are experiencing inflationary cycles, and stay away from those that are in full blown deflation such as housing and stocks.
Speaking of stocks, here's the inflation adjusted graph of the S&P 500.

Source
In this market as well, once inflation is factored in, it becomes obvious that stocks are in a deflationary cycle and to be avoided.
In dollar terms, your 401k might have more in it than it did 10 years ago, but the problem is that it will only buy half as much, so you end up a net loser in real terms. Now compare that scenario with that of gold. Here's the price of an average home in terms of gold.

In other words, you can buy the same home now for 100 ounces of gold that sold for 500 ounces of gold less than 10 years ago. That's an 80% discount, and such is the power of being on the right side of the inflation vs. deflation argument.
![[Most Recent Quotes from www.kitco.com]](http://www.kitconet.com/images/quotes_7a.gif)

