Follow The "Smart Money"
Caught this article this morning and wanted to pass it on. What is driving the price of gold right now? The "smart money." Once the general public catches on and tries to rush into gold, there won't be enough supply to meet the demand and prices will skyrocket. Buy now while you still can.
The Silent Gold Rush is on
“ …It is, in short, the only unquestioned and generally acceptable means of payment among nations, as dollars are the only unquestioned and generally acceptable means of payment among Americans, francs among Frenchmen, sterling among the British, and so on.”
Peter Bernstein, ‘A Primer on Money, Banking and Gold.’
Peter Bernstein is no gold bug. Rather, he is one of the world’s foremost authorities on capital markets and economics. A Primer on Money, Banking and Gold was first written in 1965, when gold was still the international currency. It is our contention that in the years ahead, gold will once again resume that role.
Prior to 1971, gold was effectively the commodity with which international payments were made. The flow of gold into and out of countries said more about a nations’ economic health than anything else. Indeed, the outflow of gold from the US in the late 1960s ultimately triggered President Nixon’s decision to suspend gold convertibility. In a fateful decision, the global financial system’s link to sound money was broken.
Ever since, the world has been on a US dollar standard, a monetary system where only one country has the benefit of borrowing and repaying debt in its own currency. In order for this system to prosper, the true international currency, gold, needs to be discredited. We believe gold has been held down for many years in order to allow the US dollar based international financial system to survive. But the official grip on the gold price is beginning to weaken, perhaps this time for good.
The smart money knows this and is beginning to move into gold. There is a silent gold rush taking place all around the world. Investors who understand gold’s role as an international currency are selling their surplus paper dollars and buying the yellow metal. This has led to unprecedented demand for bullion and coin dealers everywhere are struggling to meet this demand.
The Australian newspaper reported over the weekend that the Perth Mint is not taking any more orders for gold until January. Our guess is that the Mint does not want to expose itself to higher future prices given that it does not have the inventory to meet the demand for bullion. In a recent report, The World Gold Council said investment demand for the September quarter was $10.7 billion, double last year’s quarterly total.
Yet the price of gold in US dollars has been under pressure and gold producers have little incentive to increase output at these price levels. Even in Australian dollars, the price of gold is not high enough to encourage increased production. According to Bloomberg, Australian gold production was down 8% in the third quarter.
Strong demand and weak supply should be creating much higher prices.
![[Most Recent Quotes from www.kitco.com]](http://www.kitconet.com/images/quotes_7a.gif)
Click to Enlarge
Close Call For US Banks


Hidden In The PPI Data Was The Largest Food Price Spike In 26 Years
Food prices are volatile, but this move can't be ignored given its historical significance:
Excluding often-volatile food and energy prices, the core PPI increased 0.1% in March and is up 0.9% compared with a year earlier. The big story in the March PPI was wholesale food prices, which rose 2.4%, matching the biggest gain in 26 years. Prices of fresh and dried vegetables soared 49.3%, the most in 16 years.
Marc Faber, legendary Hong Kong investment manager recently had this to say about the suppression of gold prices.
"If market manipulation exists then it is good for gold buyers since it keeps the price down.
"If you have manipulation to keep the price down, it eventually goes ballistic. So, all the people that are bitching about the manipulation of silver and gold should be happy that it is manipulated because it still gives them an opportunity to buy it at a depressed priced,” Faber said.
Tea Party
Republicans eagerly embrace the Tea Parties, but I caution you: DON’T BE FOOLED. The only
difference between the two parties is the difference between the Gotti’s and Gambino’s, organized crime families. Look no further than Senator Lindsey Gr@ham to see this on full regalia. -- Ty Andros
Republicans eagerly embrace the Tea Parties, but I caution you: DON’T BE FOOLED. The only
difference between the two parties is the difference between the Gotti’s and Gambino’s, organized crime families. Look no further than Senator Lindsey Gr@ham to see this on full regalia. -- Ty Andros
Richard Russell On Gold
publisher of the Dow Theory Letters since 1958
April 23, 2010 --Confession -- I've spent roughly 64 years studying the stock market on a daily, weekly and monthly basis. I'd say that 80 percent of that time I was perplexed or unsure of my stand. I know in the advisory business you are always expected to know exactly what's going on and where to place your money. In my experience, the more cock-sure the advisor, the bigger the quack.
One problem is that the stock market isn't always talking, and when it isn't, many advisors create scenarios so they can carry on the illusion for their readers that they, at all times, understand what is happening.
How about what's happening now? Here's what I think or suspect. I think we're in a long-term bear market and currently operating in a rally in the bear market, a rally that most people take as a new bull market.
I firmly believe we're witnessing a great primary bull market in gold. This bull market is opposing a long-term bear market in fiat or non-intrinsic currencies. Since there is no discipline putting a limit on fiat-currency production, I believe in our lifetimes we will see the end of fiat currencies as acceptable substitutes for real money. When that happens, there will be no ceiling for gold. In their guts and in their hearts, every seasoned investor knows this, which is why the bull market in gold will continue.
How high will gold go? Wrong question,how low will fiat currencies go? The answer, as Bob Dylan might say, is "blowin' in the wind."
I think gold is now under heavy accumulation. I note that gold is often knocked down in the thin after market. I'm beginning to think that this is done on purpose. Large interests who want to accumulate gold have a reason to want to knock gold down, and thereby be able to accumulate it at "reasonable" prices. The last thing they want is for gold to run away on the upside before they have accumulated as much as they are able. I think this is particularly true of China and Russia and other Asian nations.
How Safe Is Your Bank?
Click HERE to find out the Texas Ratio of your bank. What is the Texas Ratio? The Texas ratio is a measure of a bank's credit troubles. Developed by Gerard Cassidy and others at RBC Capital Markets, it is calculated by dividing the value of the lender's non-performing assets (Non performing loans + Real Estate Owned) by the sum of its tangible common equity capital and loan loss reserves.
In analyzing Texas banks during the early 1980s recession, Cassidy noted that banks tended to fail when this ratio reached 1:1, or 100%. He noted a similar pattern among New England banks during the recession of the early 1990s.
The Wealthy Flee Paper Currencies
from Eric King at King World News
The wealthy are on a buying spree. Their goal is to lessen their exposure to paper currencies. From Richard Russell’s piece, “I watch the jewelry auctions, and I subscribe to the Sotheby’s and Christie’s catalogues. Prices for top-grade gems are going through the roof. I was talking to a jeweler friend yesterday who just returned from a Sotheby’s auction. He said he couldn’t believe the prices that some of the jewelry was going for. One diamond that he expected to be able to buy for $200,000 went for $950,000. He said he was staggered by the prices. “ April 27, 2010
I interviewed Henri Barguirdjian President and CEO of GRAFF the largest fine jeweler in the world and Henri talked at length about what the wealthy are doing with their money. He also discussed their growing fear of paper assets and currencies. Here is a link to the interview:
GRAFF CEO Interview on King World News
Gold Most Likely to Double: Puru Saxena
23 April 2010, 04:37 p.m. EST
By John Dourekas
Of Kitco News
Hong Kong (Kitco News) -- Gold will most likely double from its current $1150 an ounce during the course of the bull market, according to Puru Saxena, founder of Puru Saxena Wealth Management.
In an exclusive interview with Kitco News, Saxena said one major factor in gold’s favor "is that central banks have now become net buyers of gold. So that reduces supply from the market,” said Saxena.
Investment demand will appreciate over time as people become more dubious over currencies and they transfer assets into gold as a hedge, said the investment adviser from his Hong Kong office.
He thinks inflation will occur at an accelerated pace over the next few years. "Real interest rates are negative in most countries, so gold should continue to benefit purely as an anti-currency because people lost faith in the euro and the dollar," he said. "At some point people are going to say well, ‘we don’t want to lose purchasing power in currencies that are dubious, we want gold as an insurance.’”
Quit Supporting The Crooks
Everytime you put money in the bank you enable them to keep hiding their bankrupt condition and thereby making the eventual day of reckoning that much worse. Even the mainstream Wall Street Journal dared point out the obvious.
Everytime you put money in the bank you enable them to keep hiding their bankrupt condition and thereby making the eventual day of reckoning that much worse. Even the mainstream Wall Street Journal dared point out the obvious.
Wall Street Journal - “Major banks have masked their risk levels in the past five quarters by temporarily lowering their debt just before reporting it to the public, according to data from the Federal Reserve Bank of New York. At the end of each of the past five quarters (in billions $), large banks reduced their net short-term borrowings in the repo market, lowering risk profiles they release to the public, before boosting their borrowings in the middle of each successive quarter. The highlighted bars indicate the end of each quarter.

A group of 18 banks—which includes Goldman Sachs Group Inc., Morgan Stanley, J.P. Morgan Chase & Co., Bank of America Corp. and Citigroup Inc.—understated the debt levels used to fund securities trades by lowering them an average of 42% at the end of each of the past five quarterly periods, the data show. The banks, which publicly release debt data each quarter, then boosted the debt levels in the middle of successive quarters.”
Picture Of A Depression
 (Click chart to enlarge)
“That blue line is the REAL GDP in the economy going back to the early 1990s. It is final private demand on a y/o/y basis. You will note that it is in fact down more than 20% from the peak (these are compound annual change rates.)
The reason we have not seen an all-on collapse - yet - is that the government has stepped in and has borrowed and spent a literal $3 trillion over the last two years for the purpose of hiding the insolvency of virtually every bank and a good number of citizens in this nation [political entrepreneurs and crony capitalists]along with virtually every pension plan, annuity and other "defined benefit" plan and institution.
They also changed the rules of the game regarding asset valuations - that is, they cheated. This gambit has produced a veneer of recovery.
So now you have "economic recovery", you say? Like hell. You have an economy that is literally bleeding from the femoral artery as the nation's left leg has been severed above the knee by a bunch of homicidal maniacs on both Wall and K Streets. The patient is alive only because they are pumping in blood at a rate that exceeds that which is spraying all over the floor while you're calling the patient "healing"?”
Opportunity Knocks
The greatest transfer of wealth from those who hold it in paper to those who don’t is UNDERWAY,a Crack-up Boom looms. This is set to accelerate until the final crisis in which the public understands they have been the victims of the greatest FRAUD in history, also known as UNSOUND Fiat money….Courtesy of the governments and banking systems in which they have MISPLACED their trust.
This is the greatest OPPORTUNITY in history for prepared investors, and the greatest THREAT to those who are not. As REALITY is priced into markets, VOLATILITY will expand and push markets UP and DOWN to price in the NEW NORMAL of no growth except through misstated inflation. Restoring the functions of money so you can ONCE again store wealth in paper.... Traderview Newsletter, April 14, 2010
Not Much Time Left? Build Cash Now!
As I recall Dr. Robert McHugh’s work after the 2008-2009 decline, he told his subscribers to enjoy the (B) wave up because it was going to be a great gift. Use that time to sell stocks and build cash. McHugh always warned people against shorting the markets. But sell into the (B) wave up and get ready for the (C) wave down because it has the potential to not only take out the lows of March 2009, but also, he said, the Dow has a chance to decline into the zero to 1,000 range. That is also consistent with Ian Gordon’s number of 1,000 and Robert Prechter’s number of something in the 400 to 600 range. McHugh believes there are several major head-and-shoulder formations that suggest this kind of decline could be a global phenomenon.
As I recall Dr. Robert McHugh’s work after the 2008-2009 decline, he told his subscribers to enjoy the (B) wave up because it was going to be a great gift. Use that time to sell stocks and build cash. McHugh always warned people against shorting the markets. But sell into the (B) wave up and get ready for the (C) wave down because it has the potential to not only take out the lows of March 2009, but also, he said, the Dow has a chance to decline into the zero to 1,000 range. That is also consistent with Ian Gordon’s number of 1,000 and Robert Prechter’s number of something in the 400 to 600 range. McHugh believes there are several major head-and-shoulder formations that suggest this kind of decline could be a global phenomenon.
Russians Still Buying Gold
The race among world governments to accumulate as much gold as possible is now officially "on." This from Casey Research concerning Russia.
Russia's Central Bank purchased 500,000 ounces of gold in March... bringing their total gold stash to 21.3 million ounces. Without doubt, all this gold would have been purchased from Russia's own mine production.
The really interesting part about their central bank's purchases in the first quarter of 2010 is that they are off to their biggest [reported] first quarter gold purchases in history. In Q1/07, their net purchases were zero. In Q1/08 they purchased 200,000 ounces... and in Q1/09 Russia's central bank purchased 360,000 ounces. But in Q1/10 they bought a monstrous 800,000 ounces. March 2010 purchase of 500,000 ounces is tied for the third-highest gold purchase for any one month...ever! If they keep this up, heaven only knows how many ounces they'll have in their vaults by the end of this year.
Ed Steer of Casey Research usually has a pretty good since of what's happening in the metals markets. He had this to say this morning.
With options expiry and first day notice for delivery into the May silver contract coming up next week... all topped off with a record auction of Treasury debt... I'm not optimistic about anything earth shattering happening with either precious metal until that is out of the way... which won't be until the first week in May.
Any substantial rally after that [or even before, if I'm wrong about the time line] will depend entirely on whether the bullion banks show up to go short against any [or all] new longs that are placed. They don't even have to cover their short positions... all they have to do is put their collective hands in their collective pockets and do nothing... and we'll see a rallies in both metals that will truly take you breath away.
Banksters
Here's a reprint of a recent story on Goldman Sachs. If you think buying stocks is safe, no matter how good the company, realize that you don't know what you don't know. And those friendly bankers? Well, don't let the suit and tie fool you. They make the mob look like choir boys.
How Goldman Sachs Screwed Ghana
Goldman Sachs, the global financial institution, with fraud allegations levied against it has a long history of setting up its clients for a fall...and making handsome profits.
This is a story of how this global investment banking and securities firm screwed Ghana.
In 1998, Ashanti Gold was the 3rd largest Gold Mining company in the world. The first "black" company on the London Stock Exchange, Ashanti had just purchased the Geita mine in Tanzania, positioning Ashanti to become even larger. But in May 1999, the Treasury of the United Kingdom decided to sell off 415 tons of its gold reserves. With all that gold flooding the world market, the price of gold began to decline. By August 1999, the price of gold had fallen to $252/ounce, the lowest it had been in 20 years.
Ashanti turned to its Financial Advisors - Goldman Sachs - for advice. Goldman Sachs recommeded that Ashanti purchase enormous hedge contracts - "bets" on the price of gold. Simplifying this somewhat, it was similar to when a homeowner 'locks in' a price for heating oil months in advance. Goldman recommeded that Ashanti enter agreements to sell gold at a 'locked-in' price, and suggested that the price of gold would continue to fall.
But Goldman was more than just Ashanti's advisors. They were also sellers of these Hedge contracts, and stood to make money simply by selling them. And they were also world-wide sellers of Gold itself.
In September 1999 (one month later), 15 European Banks with whom Goldman had professional relationships made a unanimous surprise announcement that all 15 would stop selling gold on world markets for 5 years. The announcement immediately drove up gold prices to $307/ounce, and by October 6, it had risen to $362/ounce.
Ashanti was in trouble. At Goldman's advice, they had bet that gold prices would continue to drop, and had entered into contracts to sell gold at lower prices. These contracts were held by a group of 17 other world banks. Ashanti found themselves being forced to buy gold at high world prices and sell it at the low contract prices to make good on the contracts. The result? In a few weeks time, Ashanti found itself with 570 million dollars worth of losses. It had to beg the 17 banks not to force the execution of the contracts.
Who served as the negotiator for the 17 banks and Ashanti? Goldman Sachs. The same company that designed the contracts for Ashanti(making a profit in their sale.
The basic bankruptcy of Ashanti drove its stock price from an all time high of $25 per share to a paltry $4.62 per share. Thousands of investors - your blogger among them - lost their investments almost overnight as Ashanti was declared insolvent.
In the end (2003), Ashanti was purchased by their largest African competitor, AngloGold, a British company headquartered in South Africa, who bought them for a song. The Financial Advisors to AngloGold? You guessed it: Goldman Sachs.
The destruction of Ashanti Gold by Goldman Sachs was saturated with fraud and conflicts of interest: Goldman Sachs served as Ashanti's Financial Advisors; profitted form the contracts they designed and marketed for Ashanti; was involved in the manipulation of the gold prices on which the contracts depended; represented Ashanti's creditors when the contracts went bad; and profitted as the Financial Advisors to the company that picked up the Ashanti corpse for pennies on the dollar.

I own my physical gold and I will never sell it, says Marc Faber
INTERNATIONAL. Marc Faber, the Swiss fund manager and Gloom Boom & Doom editor, warns that when the next crisis hits, 'you'd see people flee from all paper currencies into precious metals'.
Speaking in an exclusive two-part interview with The Daily Crux, Faber said: "When the percentage of interest payments to tax revenue gets too high, it will become clear to everyone that the government will need to print money in earnest to make these payments. That's when you're likely to see a crisis of confidence in the dollar".
"The question is will there be a crisis of confidence in all paper monies and what will the reaction of investors be? I would imagine that when the crisis really emerges, you'd see people flee from all paper currencies into precious metals," Faber added.
Does he think gold will fall anytime soon below US$1,000, or even US$900?
Faber wouldn't rule out a move to the US$950-US$1,000 level, where gold broke out last year.
"My sense is that if gold went lower than US$1,050, the Chinese would come in and buy some. I think they're waiting for lower prices".
"But honestly, I'm telling everybody in the world the same thing. I own my gold and I will never sell it, especially when I see clowns like Ben Bernanke, Larry Summers, Tim Geithner...
When I'm looking at all these characters in government, I want to own physical gold."
"We're just coming out of a seasonal period where gold is often weak, and heading into a period of seasonal strength, so it's possible gold may start outperforming here," Faber said.
Explaining how investors often miss on long term bullish trends by timing the market, Faber said:" As prices rise in a bull market, investors often try to be clever, and will sell thinking they'll buy the asset back when it drops back down a bit. Of course, many times they never get the chance to do that, and end up missing a large portion of the rise."
Speaking to 'CNBC Squawk Box Europe' last month, Faber said "we already have now a gold standard created by the market place."
"We have the exchange traded funds that have proliferated and we have more and more physical buying of gold," he added.
The famed investor pointed out that between 2001 and 2008, gold outperformed bonds and stocks, but starting with 2009 stocks outperformed. "This means investors must own gold because generally retail investors cannot move in and out of different assets like institutional investors".
Investors should avoid bonds and cash over the next 10 years and choose stocks instead, he said, but warned that printing money will lead to an economic collapse in the end.
"Before we have the final collapse that will be a deflationary collapse, we will have more and more money printing."
“I think interest rates forever in the US will be at zero. By zero I mean below the rate of inflation," Faber told CNBC.
In a recent interview with a German website Faber said it is impossible for the American government to fulfill its obligations because the current deficit is already US$1.6 trillion this year.
The total US debt is already 375% of the GDP, excluding medicaid medicare and social security. If you include these, the national debt is at 600% of the GDP, he said.
The legendary investor reiterared his belief that eventually there will be a big bust and then the whole credit expansion will come to an end. But before that happens, governments will continue printing money which in time will lead to Zimbabwe-style hyperinflation, and the economy will stop responding to stimulus.

WAR: Lighting A Fire Under Gold?
War always drives investors to seek safety with gold being the ultimate safe haven. Will a middle east war provide fuel for gold this summer? Only time will tell.
Will Israelis Strike By August?
Russia has just announced that it intends to allow the Iranian nuclear reactor facility located in Bushehr (near the Persian Gulf) to go live in August. This is an ominous development. Now Israeli Prime Minister Netanyahu has a fateful decision to make. Will he order a preemptive military strike against all of Iran’s nuclear sites before August when the Bushehr site becomes “hot”? His mentor, Menachem Begin, ordered an Israeli air strike against Saddam Hussein’s Osirik nuclear reactor in Iraq before it went hot in 1981. Netanyahu wants the world to act with decisive unity to stop Iran from getting the Bomb. But that is increasingly unlikely. The Obama administration is no longer calling for “crippling sanctions,” and even if they were, it appears to be too late for sanctions to be effective. U.S. officials — including Defense Secretary Robert Gates — says Iran could have the Bomb by next year. German intelligence thinks it could be sooner. We need to pray for peace, but prepare for war.

U.S. Foreclosure Filings Rise 16% as Bank Seizures Set Record
Bloomerg - 4/15/10 - A total of 932,234 homes, or one out of every 138 households, received a default or auction notice, or were repossessed by banks, said Realty Trac... the Irvine, California-based firm said yesterday. In March, filings rose 8 percent to the most in any month since RealtyTrac began publishing reports in January 2005.
Bloomerg - 4/15/10 - A total of 932,234 homes, or one out of every 138 households, received a default or auction notice, or were repossessed by banks, said Realty Trac... the Irvine, California-based firm said yesterday. In March, filings rose 8 percent to the most in any month since RealtyTrac began publishing reports in January 2005.

YOUR 401(k)
The following is an excerpt from Rick Ackerman's daily commentary this morning and it bears reading for all those who have a 401(k) plan.
No Skin In The Game
Who could possibly believe that an economy in the throes of a debt deflation could be revived by precipitously borrowing more trillions of dollars against future output, then pumping nearly all of that money into goods and services that are economically questionable at best and purposeless at worst?
The strong impression one gets is that Wall Street believes it, since stocks have been in a relentless rise for months. It requires a healthy does of cycnicism, however, to see what has really been going on. For in fact, the public has abandoned the stock market, leaving the hedge funds and trading desks to run a shell game on the taxpayers’ dime that makes it relatively easy to hog-trade stocks higher and higher on almost no volume. This has been occurring nearly every day for months: index futures waft higher overnight on light short-covering, setting up a second wave of short-covering on the NYSE opening.
It is tempting to view this action as a wealth-creating, perpetual-motion machine, even if we know the game cannot continue forever. What is different and dangerous about this bull cycle is that those who have been causing stocks to rise – Goldman Sachs, J.P. Morgan and other Masters of the Universe – have no skin in the game. They have simply been trading amongst themselves, applying relatively small sums of cash to the leveraging of stocks against futures, options and ETFs. One senses that if the stock market were to collapse tomorrow, DaBoyz would be enjoying the show from the sidelines before the Dow had shed its first 1000 points. CALPERS and your 401K would ultimately take the hit, but for institutions whose trading desks have been racking up quarterly profits of $3 billion or more, where’s the risk? These guys are using computers that can trade many thousands of times per minute, and unless the markets freeze completely – dare we hope for so severe an emetic for the financial system? — there’s little chance the rats will go down with the ship.
Demand For Physical Gold is Quite Extraordinary
Excerpt from The Golden Truth - April 9, 2010
I also thought I would post some comments made to me by a local bullion trader who typically operates by finding private sellers and paying more than the big coin shops here, but usually at or below the spot price of gold and silver, and sells to private buyers who pay cash and do not want a paper trail. He has an excellent "nose" for supply and demand and, as per my experience trading bonds on Wall Street, there's nothing like getting market information from a bona fide market maker:
"I feel that we are in the beginning of an upward move. I can only guess at what price the market will move to. What I am finding out is that new buyers are coming into the market and they do not mind paying the premium. My past buyers are not buying as much and are looking for the market to pass $1,200, before they start to invest. The physical supply of one oz. bars and coins are readily available if you are willing to pay the premium. The supply gets smaller the closer you want it to spot. The only large quantity of gold coins in the uncirculated arena are scratched or nicked items."
Gold and Inflation
by David Tanner
In the 1970's, the last gold bull market, gold peaked at $850 an ounce. Gold was increasing because the government was inflating the money supply. This led to to higher consumer prices, which people mistakenly assume is the definition of inflation. But it is not. Higher prices are simply a result of the increase in the money supply. More money chasing a limited amount of goods will always drive prices higher.
So why haven't we seen higher prices yet since the government has created much more money in the last two years than they ever did in the 70's? It is because all of this newly created money has not filtered down into the system, but has remained in the pockets of the financial establishment to whom it was given (the Banksters).
So, by definition, inflation, which is simply an increase in the money supply, is here. And inflation always drives up the price of gold. Why? Because creating money out of thin air devalues the existing money supply. Therefore, the smart money will flee paper currency (dollars) and park itself in gold until the crisis has passed. This higher demand for gold as a safe haven during times of financial crisis is what drives its price higher.
So, let's ask ourselves a question.... "Where are we in this current cycle? Is gold about to top out, or is there still a long way to go?"

In terms of today's dollars, the price of gold maxed out at almost $2,000 per ounce. So from a historical perspective, gold is still not really "high" yet.
Should we expect gold to return to this level before this current crisis is over? Should we expect it to go higher? Consider the following.
First, the government ended inflation in the 70's simply by raising interest rates to 18%. This ended the borrowing which created the debt which increased the money supply. Since we had a healthy housing market and economy at the time, this drastic measure brought inflation under control and did not kill the economy. Today, no such option is available. Raising interest rates would be political suicide as it would kill the already half-dead economy and ensure that those in office would find their way back home to private practice after the next election cycle.
Therefore, the option of raising interest rates to reign in inflation, which is what ended the last gold bull market is not an option this time around.
Second, this time around, we are not just in a US crisis, but this crisis is world-wide. The Euro, as a currency, is in worse shape than the dollar. This means that there are far more people that will be piling into the gold bankwagon this go 'round. And more demand brings even higher prices.
Even though the price of gold has not yet reached its inflation adjusted peak from the 70's, we are already seeing shortages of physical gold bullion. There is MUCH more demand for gold this time around, yet the price has yet to reflect this shortage due to the Fed's interventionist policies designed to keep the price of gold under control.
And third, the supply of gold today is much less than it was during the last bull market. After twenty years of low gold prices, many gold producers have scaled back their mining and production activities, leaving the market with a supply shortfall that was not a factor in the 70's.
Combined, I believe all of the above will eventually take gold prices far past their previous inflation adjusted highs.
The Blow Off
All bull markets eventually end with a parabolic blow-off in which prices increase exponentially over a very short period of time. As you can see from the following graph, this current gold market is plotting a slow and steady path. Prices have not gone "vertical" as they did toward the end of the last gold bull market.
Conclusion

Quote of the Week
From the highly regarded and widely followed Richard Russell, publisher of the Dow Theory Letters since 1958:
"The US denigrates gold while China accumulates it... Almost every major central bank now wants to increase it ratio of gold against fiat currencies. As fiat currencies come under increasing suspicion, there's going to be a panic for gold. The last ones in the gold pot will be the Americans (who are totally ignorant regarding currencies, this after decades of brain-washing from D.C. and the Fed."
James Turk stands by his forecast of $2,000 gold this year - Audio Interview
Technical indicators tell Roger Wiegand that now is the time to buy gold - Audio Interview
Technical indicators tell Roger Wiegand that now is the time to buy gold - Audio Interview
Bank, Government Collusion
When the global economy collapsed in 2008, governments rescued the banks, the very ones responsible for the collapse. This is because without the banks’ debt-based paper money, governments could not spend the vast amounts they do not really have.
Politicians seek power and bankers seek profit and their collusion is responsible for the present crisis. Do not be surprised at the current state of affairs, the motives of the participants are clear and so are the consequences.
These are exceptional times and while we are helpless to prevent what is about to happen, so, too, are bankers and politicians. They have brought this state of affairs upon themselves and for this we should be grateful—for without their demise we would be enslaved forever. (source)
Will fraud lift gold prices to $10,000/ounce?
NEW YORK (Commodity Online): After the sub-prime catastrophe in banking and realty sector, which led to the global recession in 2008-09, it is the turn of bullion markets now.
‘FRAUD’, that is the one word which comes to any investor’s mind when s/he reads about the Commodity Futures Trading Commission (CFTC) hearing on manipulations in bullion market by gold cartels.
So, the small and clean investors have been short-changed by big cartels during the past many years, especially during the recent boom time in bullion markets. Otherwise, how will you explain the biggest boom in paper gold (Exchange Traded Funds, ETFs) in the recent past with hardly any gold available in the market.
In fact, there is no gold left in this world if all the Gold ETFs ask for physical delivery. And, if that happens only god knows what will be the gold prices in the coming months — $10000 per ounce? Maybe, even more. Because, price of a commodity which is not available at all can go up to any level due to the sheer fact that it is not there in the market. (Full Article)
Commitment of Traders Report 04/06/10
The Commitment of Traders Report is a very useful tool in determining who is doing the buying and selling in the gold market.
As you can see from the graph below, the commercials (Banks) are shorting gold (blue bars), while non-commercials (That's the rest of us!) are buying gold (yellow bars).

What does this tell us?
It tells us that without the large-scale effort by the bullion banks to short gold and force its price down, the price would be many times higher than at present.
How long can the banksters keep the lid on gold's price? Who knows. But even IN SPITE OF their massive efforts to suppress gold's price, it has managed to quadruple over the last 10 years. Stocks, bonds and bank accounts haven't even come close to this type return.
If/when the day comes that they can no longer suppress the true market price of gold, you will want to be "all in."
$1,140 Resistence Broken
Over the last few days gold has broken above the $1140 resistence line which increases the possibility that we may be at the start of the next leg up.

According to David Levinstein of Lakeshore Trading, "The price of gold recently broke through a resistance level of USD1140 as can be see in the area encircled in blue. The long-term and short-term indicators are all positive indicating a potential move to the upside of at least another US$60 – US$80. This will be a re-test of the previous all time high. And, I believe that we will see this shortly."
Stock Market Update
I thought I would pass this article from Rick Ackerman on this morning. He generally has a good sense about the directions of the markets, which is why he is on of the few newsletters I pay to subscribe to.
Don’t Bet the Ranch on Summer Doldrums
by Rick Ackerman on April 12, 2010 4:04 am GMT
“Sell in May, and go away?” Any trader who plans to employ that time-honored strategy should take good look at the chart below before dumping his or her portfolio on schedule in a few weeks. Notice that investors who exited the stock market right on time last year, at the end of April, would have missed a 12% rally that saw the Dow rise from 8168 to 9172 by Halloween, the traditional time to jump back in. The adage that tells us to “Sell in May…” is based on the fact that, historically speaking, stocks in markets around the world have made their best gains during the period November through April; moreover, those gains would have been reduced substantially by holding from mid-spring to mid-autumn. While that is certainly true based on our own experience, some statisticians have demonstrated that the effect is negligible if, when considering the performance of stocks since 1982, you strip out the two crucial years 1987 and 1998.
Whether you believe the statistics or not, memories of last summer’s powerful rally should still be fresh enough to dampen the ardor of sellers who think summer doldrums and seasonality are likely to turn the months ahead into a snooze. Summer or not, we are living in interesting times, and there is nothing to suggest that hot weather is going to slow the pace of interesting news of the kind Wall Street seems to thrive on these days.
Blowoff In Progress
So what are the odds that stocks will show the same kind of anomalous strength this summer and fall that they showed last year? It’s hard to say exactly, but our gut feeling is that, far from being ready to collapse, U.S. stocks are in a blowoff phase that is likely to steepen over the next month or two. We say that even though we strongly doubt the economy is in a sustainable recovery, and even though we believe that the most severe phase of the real estate collapse is yet to come. Quite obviously, the stock market is unconcerned about such things, and that is why the inevitable crash is a good bet to rival the one in 1929.
A “new dynamic” in the Gold Market
The revelations from the CFTC hearing are earth-shaking, and indeed a “new dynamic” has emerged. The gold cartel now has a big target painted on its forehead. One can never predict the future, but it seems to me that as this news about the gold cartel’s huge naked short position spreads, two things will happen.
It is inevitable that the big traders and hedge funds will push the naked shorts to the wall by asking for physical metal. We could therefore see more hedge funds switching out of GLD like Greenlight Capital did last summer, which leads to the second likely outcome. If we get a squeeze on the naked shorts, the sky is the limit for precious metal prices.
The gold cartel may not yet be finished, and won’t be until the unholy Wall Street-D.C. axis is dismantled. But the gold cartel is on its way out.
Over the past ten years, the gold cartel has staged a controlled retreat. It has been fighting the advancing gold price with propaganda, paper short sales and the occasional dishoarding of physical metal from central bank vaults and more recently, the IMF. This retreat is I suspect about to turn into a rout, which means the upside potential for the precious metals is huge.
Thinking of Buying Real Estate? Don't Do It!
I have many clients who have bought real estate over the last two years at these depressed prices. They think they bought in at "low" prices. But "low" is a relative term. "Low" compared to what? Yesterday's price, or tomorrow's price?
Compared to yesterday's prices, they bought in at a "low." Trouble is, compared to tomorrow's prices, they bought in at a "high."
The following chart is from Martin Armstrong, author of the Economic Confidence Model based on an 8.6 year business cycle theory inspired by the work of Nikolai Kondratieff. He correctly forcast the 2007 real estate collapse. Look at what he sees as the future of real estate.
The following chart is from Martin Armstrong, author of the Economic Confidence Model based on an 8.6 year business cycle theory inspired by the work of Nikolai Kondratieff. He correctly forcast the 2007 real estate collapse. Look at what he sees as the future of real estate.

So again, looking back, real estate is cheap right now, but looking forward, it is still way too soon to jump in.
And the same holds true with gold. Looking back, gold appears to be very high priced at present. But looking forward, we still have a long way to go.
This from Martin Armstrong's August 28, 2009 article entitled "Will Gold Reach $5,000+?"
"Gold is not a hedge against inflation, but against a collapse in confidence of the government to solve our problems."
"I have provided the technical analysis on Gold based on a monthly chart. The first real resistance is formed by the Primary Channel that shows $1,350 - $1,750 between 2010 and 2012. This represents still a plain old normal technical move with nothing that would reflect a meltdown. It is breaking this overhead resistance where it becomes support that we enter the "danger zone" of a true meltdown in Public Confidence.
"Most of the projected resistance from the majoor low back in 1999 shows various target from $1,700 to $2,750. However, if gold exceeds this level and it too forms the subsequent support, now we are looking at the $3,500 to $5,000 target zone. This is where we see potential for Gold is a true economic meltdown of Confidence."
Do YOU have confidence that governments are going to solve our problems?

$7,400 Inflation Adjusted Gold

Peter discusses the current rise in the stock market, the healthcare bill and, of course, gold.

Peter discusses the current rise in the stock market, the healthcare bill and, of course, gold.
Gold Revving for Pop to $1245?
by Rick Ackerman, Rick's Picks, on April 8, 2010 4:07 am GMT
To be sure, we have detected no underlying weakness in bullion, even if it has been reluctant to pop to the next level. If it were otherwise, pullbacks would have reached their Hidden Pivot targets. Instead, selling has dried up well short of the targets, and the subsequent rebounds have been relatively strong. The recurrence of this pattern in recent months has bullish implications, and they are corroborated by anecdotal evidence suggesting that physical gold has been difficult to buy in quantity whenever prices have dipped below $1100.
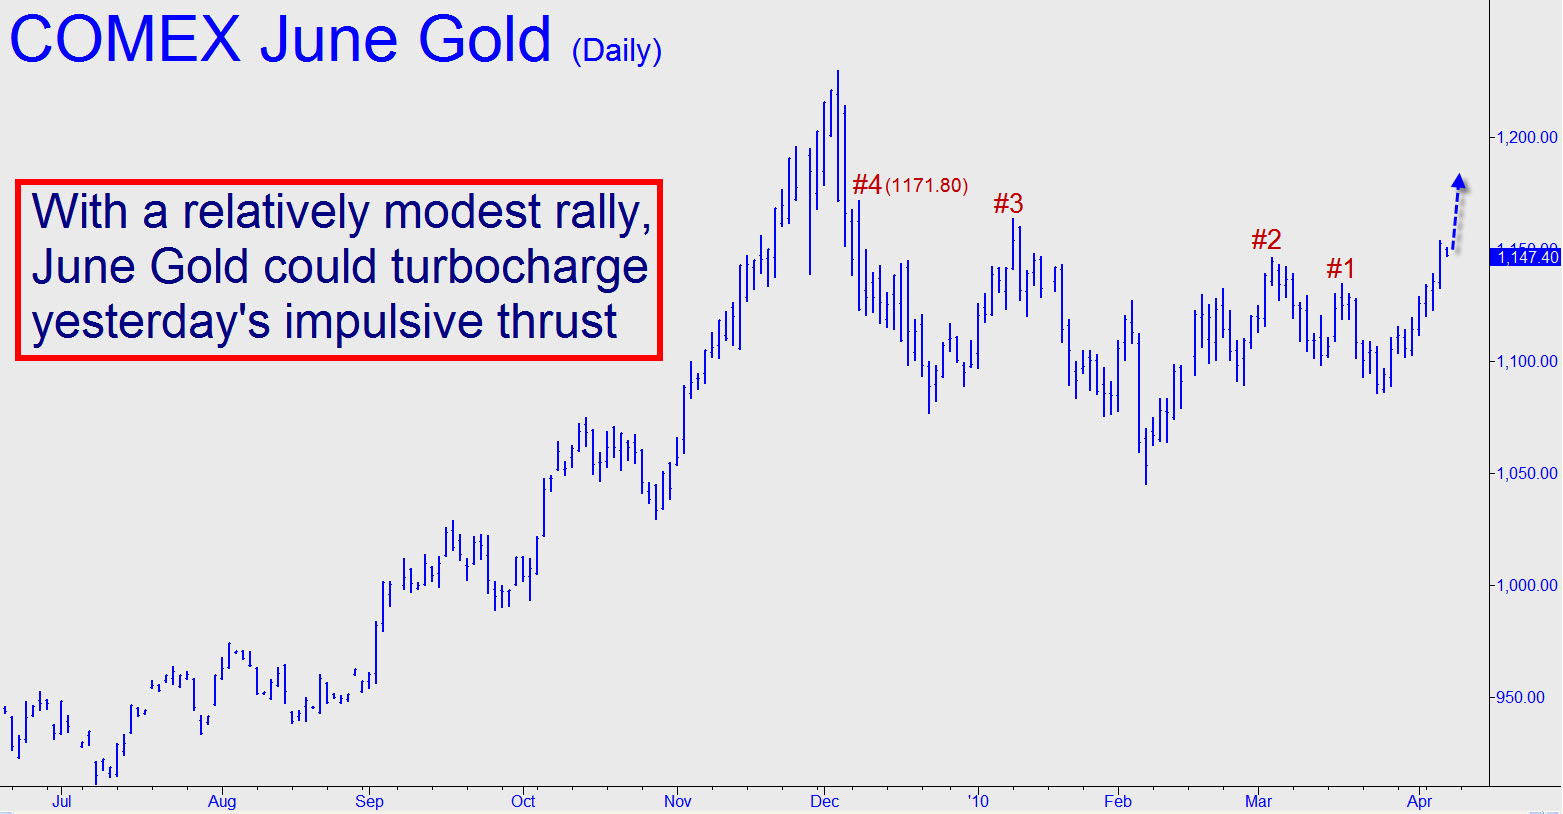
What to Look For
Now to specifics. The chart above shows that June Gold has risen without correcting since March 30, when it bottomed at 1102.40. With yesterday’s push to 1154.20, the rally has surpassed two peaks, but it need rise only a further 17.70 to exceed two more. That would create a powerful impulse leg indeed, leaving the June contract in excellent shape to sprint to at least 1245.60 before even a short breather would be needed.
To check out Rick's Picks click here.
by Rick Ackerman, Rick's Picks, on April 8, 2010 4:07 am GMT
Having spent more than a month in limbo, gold now lies just inches from triggering a potentially explosive rally. Before yesterday’s sharp surge, disappointment in the form of leaden price action had dogged bulls since early March, when Comex futures failed by a hair to surpass an important prior peak after trending higher for five days. A Formula 1 racer might as well have blown a head gasket a hundred yards from the checkered flag.
According to our proprietary Hidden Pivot forecasting method, a healthy rally re-energizes itself by surpassing two prior peaks with each new thrust. So far in 2010, however, gold has conspicuously failed to do this on its daily charts. Now, however, the June Comex contract has a chance to blow past no fewer than four prior peaks without taking a breather, and to develop enough thrust in the process to all but clinch a test of last December’s all-time high at 1230.00.
To be sure, we have detected no underlying weakness in bullion, even if it has been reluctant to pop to the next level. If it were otherwise, pullbacks would have reached their Hidden Pivot targets. Instead, selling has dried up well short of the targets, and the subsequent rebounds have been relatively strong. The recurrence of this pattern in recent months has bullish implications, and they are corroborated by anecdotal evidence suggesting that physical gold has been difficult to buy in quantity whenever prices have dipped below $1100.
What to Look For
Now to specifics. The chart above shows that June Gold has risen without correcting since March 30, when it bottomed at 1102.40. With yesterday’s push to 1154.20, the rally has surpassed two peaks, but it need rise only a further 17.70 to exceed two more. That would create a powerful impulse leg indeed, leaving the June contract in excellent shape to sprint to at least 1245.60 before even a short breather would be needed.
To check out Rick's Picks click here.
by Howard Katz
Well, it’s been a bad 5 months. Gold has mostly just gone back and forth, and gold bugs are wringing their hands in frustration. But this is the problem with using intuition in the markets. One intuitively remembers the recent past, and one forgets the larger picture. This is the big advantage of using charts. So let us look at a chart of this bull market going back to its start in early 2001 just slightly above $250.
Well how about that gold bugs? Gold has multiplied by more than 4 times over the past decade! Viewed in the big picture gold has been steadily going up. And how well has the typical establishment follower done over the past decade? Well, we might take the S&P 500 as our measure. Over the past decade, the S&P 500 has declined by 25%. Now what would you prefer – 300% up or 25% down?
Going back to the chart of gold the chart makes us recognize the big picture. And the big picture is a gradual uptrend (which over the decade amounts to considerable). This is crucially important, and it cannot be said too many times: THE BIG MONEY IS MADE IN THE BIG MOVE. And yet we are all sorely tempted to remember the small move (because it is fresh in our minds). As you can see, the fluctuations of the past 5 months are just a minor detail. Soon they will give way to another up move (such as the rally of September, October and November of last year). This will be followed by another round of profit taking, etc.
So who was better off, the gold bug or the establishment? The gold bug has 4 times as much wealth. He lives in a fine house and has a lot more stuff. He is surrounded by beautiful women. (Note to beautiful women. Gold bugs make good catches as they can treat you in the manner to which you would like to become accustomed.) On the other hand, if you are an establishment follower, you can go to parties, stick your nose in the air and pretend that you are one of the elite. Since everyone else at the party has read the same New York Times opinions, they will be struck by your great wisdom, and when you prove disastrously wrong, they will quickly erase that fact from their minds.
Going back to the chart of gold the chart makes us recognize the big picture. And the big picture is a gradual uptrend (which over the decade amounts to considerable). This is crucially important, and it cannot be said too many times: THE BIG MONEY IS MADE IN THE BIG MOVE. And yet we are all sorely tempted to remember the small move (because it is fresh in our minds). As you can see, the fluctuations of the past 5 months are just a minor detail. Soon they will give way to another up move (such as the rally of September, October and November of last year). This will be followed by another round of profit taking, etc.
One of the characteristics of the gold chart, which strikes even the casual observer, is the steadiness of the up trend. Chartists tend to be too mathematical and like to draw precise lines. But you probably get a more honest picture if you stand back and get an intuitive notion of the trend. For example, I have drawn two trendlines, AB (from 2001 to 2005) and BC (from 2005-2008.) An up trendline is drawn connecting two low points. To complete the picture, we select a prominent high point and draw a line through it parallel to the original trendline. Thus through D we draw a line parallel to AB, and through E we draw a line parallel to BC. These lines represent the top of the channel.
For example, when gold got above the line through D in early 2008, this was a signal that gold was (temporarily) too high. Together with other signals this allowed me to put out a sell signal on March 7, 2008. In essence, when gold is near the bottom of the channel (near the trendline), it is a good time to buy. When gold is near the top of the channel, it is a good time to step away and take profits. If you just interpret the lines roughly, then they give you useful information, and together with other signals you can get out close to an intermediate high. It was the same type of thinking which led to my sell signal (special bulletin) of Dec. 2, 2009. Now with the decline from $1,229 and the passage of time, gold has pulled back from the top of its channel.
A very important line (not drawn) extends from point E through $1,000, horizontally through 2008-09. This line was broken in October 2009 as gold moved above $1,000. When a technical pattern makes such a breakout, it is normal behavior to pull back to the break out point one last time before making its real advance. Thus, my original expectation (after the Dec. 2009 top) was for a pull back to $1,000.
But I argue in the April 2, 2010 issue of the One-handed Economist that this is one of those rare exceptions where the pull back does not go all the way to the breakout point, that the intermediate bottom has been made (at $1,050, not $1,000) and that we are ready for another leg up. Thus, I expect the gap between $1,050 and $1,000 to remain open, and this is such an unusual event that it must be regarded as a very powerful (in this case bullish) signal. The final proof that the gap has remained open will be a move in gold above the Dec. top at $1,229, and this event (together with the break above $1,000 back in October) will be a second signal that gold is in a massive, long term bull move.
In other words, dear gold bug, you ain’t hardly seen nothing yet.
What these considerations are telling us is that all the fundamental information which has been coming in since 1981 about the mismanagement of the U.S. economy is correct. It is merely that there is a long time between cause and effect. Ronald Reagan doubled the U.S. money supply. Bush Sr. and Jr. kept on printing money. The Treasury bill rate went from 16% to 0%. All of these distortions have to have their effect. Well, the bill has come due, and – as Ayn Rand predicted – it is marked “ACCOUNT OVERDRAWN.”
________________________________________________
Howard S. Katz was one of the early gold bugs of the late ‘60s and ‘70s, turning bullish on gold in 1965. His favorite gold stock, Lake Shore Mines, went from $3/share to $39/share over the course of the seventies (sold at $31). Katz turned increasingly skeptical about gold as it mounted its final rise in 1979, and he called the top after the close on Jan. 21, 1980 (with gold at $825.50/oz.). Katz traded gold in and out during the ‘80s and ‘90s and once again turned long term bullish in Dec. 2002. His thoughts on commodities, stocks, bonds and real estate are available in a letter entitled The One-handed Economist and published every two weeks giving specific advice on trades in stocks and futures.
Trust Your Retirement To The Sopranos
On Monday, Peter Brimelow, in his column on MarketWatch stated "J.P. Morgan Chase managed to saddle Jefferson County, Ala. (containing the city of Birmingham) with more than $5 billion debt for a sewage system originally supposed to cost $250 million, bringing it to the brink of bankruptcy. There have already been more than 20 local convictions for corruption, plus an SEC fine for J.P. Morgan."
He goes on to say that "anyone dealing with Wall Street is in effect putting themselves in the hands of the Sopranos. It's hard to see how any economy can survive this sort of predatory parasitism."
Question: If they can do this to a whole county, what do you think they are doing with your money?
Watch China!
Higher demand brings higher prices, and China's appetite for gold is sure to bring higher prices as the world's newest financial superpower continues its buying binge.
This from Adrian Ash at BullionVault.com
Rising 85% by weight since 2004, China's private gold demand has more than quadrupled in Dollars. It pretty much doubled by value in terms of both Dollars and the Renminbi in the last two years alone, rising to $13.6 billion in 2009.
Overall, China accounted for more than 14% of global gold investment and jewelry demand last year on the World Gold Council/GFMS data - a close second to the 16% of private world hoarding swallowed by India.
Now the World Gold Council forecasts that China's annual gold consumption has the potential to double in the next 10 years. Its new report notes the link between China's gold demand, runaway GDP growth, and phenomenal household savings rate. But it doesn't put a figure on that relationship - itself a blunt rebuke of the idea that modernization and consumer capitalism would see gold cast off as a barbaric relic...
The Coming Precious Metals Short Squeeze
by John Rubino DollarCollapse.com
As for why central bank manipulation of gold’s exchange rate portends a dramatic spike in gold’s exchange rate, let’s revisit Chapter eight’s brief explanation of how central banks lend their gold to private sector bullion banks, which then sell it on the open market. Because the bullion banks have promised to eventually return the borrowed gold to the central banks, they, in effect are “short” gold. That is, at some point in the future they are obligated to buy gold in order to repay to the central banks. The bullion banks thus benefit when gold is available at a low exchange rate, and are hurt, potentially very seriously, when gold rises.
By the end of 2002, I estimate that the amount of gold that central banks had loaned out was at least 12,000 tonnes, or about 385.8 million ounces. That’s almost five times the world’s annual gold production, worth about $160 billion. If the banks have borrowed this gold at an average of $350 ($11.25gg), and gold rises to $400 ($12.86/gg) (leaving the euro out of this equation for simplicity), the bullion banks are looking at a loss of $50 times 385.8 million ounces, or $19 billion. If the banks borrowed at $300 ($9.64/gg) on average, they’re facing a potential loss of $38 billion, more than enough to bankrupt some of the more aggressive players.
As the cost of acquiring gold begins to rise, the bullion banks might be tempted to cut their losses by covering their shorts (i.e. buying back their gold) en mass. In the stock market this is known as a short squeeze, and it often results in a buying panic, in which everyone heads for the exits at once, sending the price of the security in question through the roof. For the bullion banks the short squeeze is a terrifying prospect because of the potential losses they might incur. For the central banks, a short squeeze in gold is equally terrifying because the result will be, in effect, a massive devaluation of their currencies versus gold, potentially undermining the monetary status quo they try so hard to maintain.
In any event, the failure of one or more bullion banks (remember, these are among the world’s biggest financial institutions) might threaten the entire global financial system, a prospect that no doubt has central bankers shaking in their boots.
Viewed this way, the recent gyrations in the gold market make perfect sense. When free individuals, observing the debasement of the world’s fiat currencies, begin to bid up the exchange rate of the one money that’s immune from debasement, the bullion banks run to Washington (or Paris or London) for a bailout, and the central banks oblige by pushing gold back down. But the game is just about up. The bullion banks’ short positions have reached unmanageable proportions, and gold’s exchange rate is surging into the danger zone. A short squeeze is coming, and for the world’s central banks (and bullion banks’ shareholders) it will be a disaster. But for those who value and understand gold’s enduring role as money, it will be a classic case of poetic justice.
Gold's Price Suppression Hits Mainstream News Media
by David Tanner
Since the testimony by former London metals trader Andrew Maguire before the Commodity Futures Trading Commission last week, scores of articles have been hitting the mainstream press trumpeting the fact that JP Morgan, Goldman Sachs et. al., through their front organizations of the Federal Reserve and other central banks, have been suppressing the gold price for years now.
Wow, look who just caught up!
Before we go any further, let's answer one question: "Why would central banks care about gold’s exchange rate in the first place?"
According to John Rubino, former featured columnist for thestreet.com, "It is because gold is money, it is one of the yardsticks by which the world’s currencies—and the central banks which manage them—are measured. When gold’s exchange rate is low relative to the dollar and euro, central banks appear to be doing a good job of keeping inflation down and the value of their fiat currencies up. So part of the central banks’ motivation has no doubt been to keep exchange rates at favorable levels – by keeping gold undervalued – thus making their currencies and themselves look good."
With gold out of the picture, central banks, which are nothing more than front organizations for the private banking cartel, can continue to print money and pay interest on that money to the banksters.
Of course, all insiders know this ponzi scheme exists, but no one has the clout, or guts, to do anything about it as the banks own the politicians that oversee their activities. But, times are changing.
Maguire's testimony (video below) before the CFTC brought public the fact that there is a 100 to 1 ratio in the amount of gold futures that are traded to the actual amount of gold that backs those contracts.
In essence, the general population now can see, for those who wish to look, the emporer has no clothes.
With supply and demand determining the price of gold, being able to create imaginary supply via the futures markets has allowed the bullion banks to "manage" the price of gold to their benefit.
So, what is the bottom line here?
The price of gold has quadrupled in the last 10 years because those inside the market know that this supply of "paper" gold doesn't really exist. They have been buying physical gold and driving its price up IN SPITE OF THE FACT that the bullion banks have been doing all they can to keep the lid on gold's price.
NOW that hundreds of millions of people are getting in on this little secret, thanks to Mr. Maguire's testimony, we can expect much more investor demand for physical gold in the years to come. And, as we all learned in Econ 101, higher demand brings higher prices.
Avoid the future stampede and buy gold now, unless you have a moral problem with becoming rich.
What To Buy Now
There are only two reasons to buy gold. The first, and most important, is for insurance. Gold protects ones wealth against confiscation through devaluation of paper currencies.
The second reason one buys gold is for investment purposes. It's hard to argue that gold hasn't been a good "investment" over the last decade.

Once the decision has been made to purchase gold, then comes the decision on what type of gold to buy. Should one by the cheapest gold one can find, ie. gold bullion bars or coins, or should one pay a little more up front and buy gold that has a "collectible" component to it?
Let me phrase this question another way. Should you buy as many ounces as you can for preparation against financial meltdown, OR, should you buy a type of gold that may perform better as an "investment" in case the coming financial meltdown is delayed 5, 10 or 15 years?
Tough decision isn't it?
To help you answer that question for yourself, let's go back in time to a period not unlike today and look at the performance of two different types of gold.
Pre-1933 US Gold
Prior to 1933 the United States minted gold coinage for circulation. Whether you had a one ounce $20 gold piece in your pocket, or a $20 bill, both would buy the same thing. Both were readily accepted as payment for goods and services, and either could be easily exchanged for the other at your local bank.
The US quit minting gold coin in 1933 and outlawed private gold ownership. Citizens were required to turn in their gold coin in exchange for paper currency. The surrendered gold coinage was subsequently melted down by the government and stored at Ft. Knox. Some citizens refused to surrender their gold and kept it quietly hidden until 1971 when private gold ownership was once again legalized in the US. Still others simply shipped their gold out of the country into foreign deposit boxes.
Because of this, there is a very limited amount of Pre-1933 US Gold Coinage still in existence. Because of this "rarity" factor, the price of this type of gold generally carries a premium over its gold content. For example, today the spot price of gold is $1,200 per ounce. Common 1 ounce gold bars can be purchased today for about $1,260 each, about 5% over the spot price of gold.
However, an older Pre-1933 $20 gold piece that is almost one ounce of gold (.9675 oz.) can be purchased at present for around $1,500, which is a 30% premium over the spot price of gold.
Now, any rational person would be asking at this point in time "why would anyone want to buy the more expensive gold?" And here's the answer.
Back in 1989, the peak of the last gold bull market, premiums of the $20 gold pieces skyrocketed to over 100% of the underlying value of the gold. Therefore, the investment return of the investor who bought the cheapest gold he could find was based solely on whether gold went up or down in value. But the investor who bought the $20 gold pieces not only saw the value of his investment go up or down based on the underlying swing in the price of gold, but also saw the value of his investment go up over 100% based on the premiums demanded for these type coins.
Although I doubt this will ever happen, many investor feel like the Pre-1933 gold coins would be exempt from confiscation should the government ever come for our gold. The logic is that these types of coins would be considered "collectible" whereas bullion coins are not. And the last time gold was made illegal for private ownership, "collectible" gold was exempt.
So, everytime there is a new gold rush, premiums on the older coinage go through the roof, and it is for THAT reason that, strictly as an "investment," Pre-1933 gold makes more sense than bullion.
The $5 Liberty
Today, I personally am buying $5 gold Liberties. Here is why:
1.) RARITY - Because of the above, I know the premiums on these coins will likely see a substantial increase as our economic/governmental situation deteriorates and citizens become more alarmed that the Feds will once again confiscate gold.
2.) SIZE - I like the fact that it is a smaller coin, almost a quarter of an ounce, which makes them desirable for barter. Again, do I personally buy these coins because I think I am going to have to barter them? No. But a lot of people do, and THAT's what makes the premiums go up everytime there's a gold rush.
3.) LOW PREMIUMS - Common date, circulated $5 Libs can currently be purchased at about $375 each, making their cost about $1,550 an ounce, a 30% premium over the spot price of gold. As you can see from the example below, this could be quite a bargain when you consider that this particular denomination saw premiums soar up to 3,000% in 1989.
4. DOWNSIDE PROTECTION - Whether you are buying newly minted bullion or Pre-1933 gold coins, the premiums paid at purchase are recouped upon selling your gold back to the dealer. The percentage difference between the buying and selling price is the same regardless of the type gold you buy.
A Glimpse Of History
Suppose you had the choice of what to buy with $10,000 on Jan. 1, 1984. Since gold was at $383/ounce you could have bought $5 Libs at about $132 each, or you could have bought $10 Libs at about $264 each. This assumes you paid a 44% premium over spot, which is the average like today. Or, you could have just bought some 1 ounce bullion coins and paid about a 7% premium over spot (Today's market average), which comes out to about $410/coin.Although I doubt this will ever happen, many investor feel like the Pre-1933 gold coins would be exempt from confiscation should the government ever come for our gold. The logic is that these types of coins would be considered "collectible" whereas bullion coins are not. And the last time gold was made illegal for private ownership, "collectible" gold was exempt.
So, everytime there is a new gold rush, premiums on the older coinage go through the roof, and it is for THAT reason that, strictly as an "investment," Pre-1933 gold makes more sense than bullion.
The $5 Liberty
Today, I personally am buying $5 gold Liberties. Here is why:
1.) RARITY - Because of the above, I know the premiums on these coins will likely see a substantial increase as our economic/governmental situation deteriorates and citizens become more alarmed that the Feds will once again confiscate gold.
2.) SIZE - I like the fact that it is a smaller coin, almost a quarter of an ounce, which makes them desirable for barter. Again, do I personally buy these coins because I think I am going to have to barter them? No. But a lot of people do, and THAT's what makes the premiums go up everytime there's a gold rush.
3.) LOW PREMIUMS - Common date, circulated $5 Libs can currently be purchased at about $375 each, making their cost about $1,550 an ounce, a 30% premium over the spot price of gold. As you can see from the example below, this could be quite a bargain when you consider that this particular denomination saw premiums soar up to 3,000% in 1989.
4. DOWNSIDE PROTECTION - Whether you are buying newly minted bullion or Pre-1933 gold coins, the premiums paid at purchase are recouped upon selling your gold back to the dealer. The percentage difference between the buying and selling price is the same regardless of the type gold you buy.
A Glimpse Of History
You would have ended up with about:
76 - $5 Libs, or
38 - $10 Libs, or
24.5 – 1 ounce bullion coins/bars
All would be worth $10,000 each on January 1, 1984.
But on June 2, 1989 they each would be worth the following:
76 - $5 Libs @ $2,850 each = $216,600
38 - $10 Libs @ $3,050 each = $115,900
24.5 – 1 oz. bullion coins/bars @ $361 each = $8,844
Still think that extra premium isn't worth it?
Trading the Premium
At that point, you should sell your $5 Liberties and lock in your gains on the rise in premium and buy cheap bullion with the proceeds, in which case you would end up with 598 ounces of gold as opposed to the 24.5 ounces that the "smart" investor still has. This strategy is known as "trading the premim" as has been used by knowledgeable gold investors for years.
Conclusion
If you know the world is coming to an end tomorrow, then buy the cheapest thing you can find. On the other hand, why not hedge your bets a little just in case this thing takes longer to go down than we think?
The "Big One" Coming Soon?
From CaseyResearch.com.
And, as James Turk said above, there's a "new dynamic" in the precious metals market now that whistle-blower Andrew Maguire has come in from the cold and finally spilled the beans on JPMorgan's antics in the silver market. Even though the main-stream media in the United States has not picked up this story... you can rest assured, dear reader, that there isn't a single person associated with the precious metals market in any capacity... whether it be producer, user, regulator, or investor... that doesn't know that the game is now on. It's just a matter of how it manifest itself... and when.
I'm still "all in"... and I'm only speculating here, but my feeling is that Thursday's price activity in the precious metals... and the associated price reaction by their respective equities... is a foreshock to the main event... whatever that may be. Therefore, I suggest that this might be a good time to place your bets in the precious metals arena... and a subscription to either Casey Research's flagship publication, the International Speculator... or Casey's Gold & Resource Report is something that you should seriously consider to help you make a decision about which are the best stocks to buy.
"Next move higher in Gold looks imminent"
In a short report from CitiFX yesterday, the analysts state the following... "We continue to believe that this leg in the bull market in Gold can take us above $1,300 and that eventually we can see levels above $2,000. To us, the present set up looks like it is poised to accelerate to the [upside]. A break of $1,135-1,145 would strongly support this view and suggest a quick move to re-test the December 2009 high at $1,226." There's no link to this, as it was obviously meant for some of Citigroup's private clients... as it's not posted anywhere I can get at it. Citigroup has a very minor short position in the precious metals market... a few percent at most... and are not one of 'da boyz'.
In a short report from CitiFX yesterday, the analysts state the following... "We continue to believe that this leg in the bull market in Gold can take us above $1,300 and that eventually we can see levels above $2,000. To us, the present set up looks like it is poised to accelerate to the [upside]. A break of $1,135-1,145 would strongly support this view and suggest a quick move to re-test the December 2009 high at $1,226." There's no link to this, as it was obviously meant for some of Citigroup's private clients... as it's not posted anywhere I can get at it. Citigroup has a very minor short position in the precious metals market... a few percent at most... and are not one of 'da boyz'.
U.S. Mint Gold & Silver Eagle Sales Strongest Ever!
The U.S. Mint, which had obviously been withholding sales data for most of March, showed monstrous increases in sales of both gold and silver eagles. One ounce gold eagle sales jumped by 37,500 to end the month at 102,000. In silver eagles, the mint reported selling a gargantuan 1,481,000 to end March with total sales of 3,381,000. Year-to-date/end of quarter figures for both are as follows: One-ounce gold eagle sales... 271,000. Silver eagle sales... 9,023,500. The silver eagles sales for the first quarter of 2010 was the best single quarter ever in the history of silver eagles program... which started back in November of 1986... almost 25 years ago.
The U.S. Mint, which had obviously been withholding sales data for most of March, showed monstrous increases in sales of both gold and silver eagles. One ounce gold eagle sales jumped by 37,500 to end the month at 102,000. In silver eagles, the mint reported selling a gargantuan 1,481,000 to end March with total sales of 3,381,000. Year-to-date/end of quarter figures for both are as follows: One-ounce gold eagle sales... 271,000. Silver eagle sales... 9,023,500. The silver eagles sales for the first quarter of 2010 was the best single quarter ever in the history of silver eagles program... which started back in November of 1986... almost 25 years ago.
For Gold Traders, a Fibonacci Road Map
by Rick Ackerman on April 1, 2010 5:22 am
What does Fibonacci analysis predict for gold over the next year? We recently heard from a skillful practitioner of the dark arts, “Mestre Socrates,” who sees $1490 an ounce by around next May. But there’s a chance the path will not be smooth, he cautions, since prices could first dip as low as $1012 – more than $100 beneath current levels. That would represent a great buying opportunity, however, according to Socrates – a place where bulls could back up the truck. How confident is he? Socrates notes that gold’s long-term price movements have been precisely foreseeable on the basis of Fibonacci sequences that have traced out cup-and-handle formations. “Gold appears to have a predictable trading pattern of a new high, a slam down to the previous Fib level, reworking back to the previous high, a dull six-month ‘handle formation’ period, and then a two or three-month rally to a new Fib level. This has given workable projections for the gold price years in advance.”
Subscribe to:
Posts (Atom)